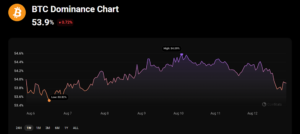
Bitcoin, the first commercial cryptocurrency, has a key indicator called BTC dominance. The BTC Dominance Chart represents this measure, which is tradable. Initially, Bitcoin had 100% of the crypto market share, but when other cryptocurrencies emerged, such as Litecoin and Ethereum, its dominance began to wane. However, it remains an important statistic for assessing the overall health of the crypto industry.
What is the BTC Dominance Chart?

The Bitcoin Dominance Chart serves as a market sentiment indicator in addition to displaying the percentage of Bitcoin’s market capitalization. It helps determine the market’s risk appetite by reflecting the fluctuating interest of investors in altcoins vs Bitcoin.
This graph, which shows times when Bitcoin is preferred over other cryptocurrencies and vice versa, is essential for comprehending market dynamics.
- Bitcoin Market Cap: ₹99T
- Total Market Cap: ₹183T
- Weekly Range: 53.52 – 54.59%
After capturing a 100% market share at first, Bitcoin’s dominance has changed due to a number of variables, including changes in the world economy, news about regulations, and advancements in cryptocurrency technology. These modifications reflect how the cryptocurrency market is developing and how investors are reacting to these changes.
In what ways may investors utilize the Bitcoin Dominance Chart?
The BTC Dominance Chart might be considered a tactical instrument for investors. An increase in dominance might indicate a shift in market attitude about Bitcoin’s relative safety, which would suggest caution.
On the other hand, a fall indicates a move towards altcoins, which is frequently observed in more speculative or optimistic market environments. This knowledge facilitates the making of educated financial decisions.
Bitcoin dominance is an important indicator for cryptocurrency traders because it provides information about the market’s general sentiment and possible trends.
The market capitalization of all cryptocurrencies is divided by Bitcoin’s market capitalization. This measure aids traders in comprehending Bitcoin’s market power and how it relates to other cryptocurrencies.
A movement in Bitcoin’s dominance can signal changes in the market’s dynamics, making it a useful tool for managing risk and identifying trading opportunities. To help them make wise selections, traders frequently combine this measure with additional data.
How does the Bitcoin Dominance Chart predict the altcoin season?

The BTCD measures Bitcoin’s (BTC) market share in relation to the whole cryptocurrency market, and a decline in Bitcoin dominance may signal that altcoins are gaining popularity.
This is known as an altcoin season, and it happens when more investment is directed into altcoins than Bitcoin. During altcoin seasons, some believe it is feasible to make more money by owning a range of minor cryptos rather than only Bitcoin.
An altcoin season may be signaled by a decline in Bitcoin’s market share, particularly in a bull market. This implies that investors are gravitating toward cryptocurrencies, which is fueling their rise in acceptance and value. However, altcoin technology developments and market liquidity also have an impact on this.
Which Factors Affect the Market Domination of Bitcoin?
Numerous reasons contribute to the market domination of bitcoin. These include:
- The mood among investors, updates on regulations, developments in technology
- The general expansion of the cryptocurrency sector.
- The market’s opinion of Bitcoin as a “digital gold” with an established status also plays a significant factor.
- The cryptocurrency market’s dominance may fluctuate due to the introduction of new altcoins, shifts in market liquidity, or important economic events that impact it.
By being aware of these aspects, investors may more accurately assess market movements and their possible effects on Bitcoin’s dominance.
What Does the Dominance of Bitcoin Tell Us About the State of the Cryptocurrency Market?
Bitcoin’s dominance often serves as a barometer to assess the state of the cryptocurrency industry.
A strong dominance shows Bitcoin leading the market, which typically occurs during uncertain times when investors prefer more reputable assets.
On the other hand, a lesser dominance may signify a healthy diversification into altcoins and a level of investor assurance in the cryptocurrency industry as a whole.
But it’s crucial to take this parameter into account in addition to other elements like market liquidity and the state of the world economy.
Conclusion
The Bitcoin Dominance Chart is a key tool for understanding the balance of power in the cryptocurrency market. When Bitcoin’s dominance is high, it often means investors are playing it safe, sticking with the most established cryptocurrency. On the other hand, a drop in dominance suggests a growing interest in altcoins, which can lead to periods where these alternative cryptocurrencies outperform Bitcoin.
This chart helps investors make smarter decisions by indicating market trends, but it’s important to consider other factors like global events and technological developments. In short, Bitcoin’s dominance gives a snapshot of the market’s mood and can guide investment strategies in the ever-changing world of crypto.


