Since trade began in early June 2024, Mcoin, the native token of the M20 Chain, has been continuously declining. But the price of the token might not be out of the woods just yet.
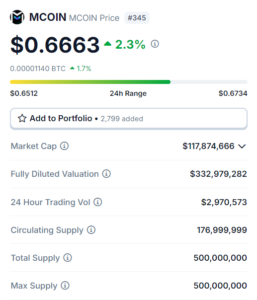
The core of the M20 Chain ecosystem is MCOIN, which is utilized for trading, gas fees, utilities, governance, and NFT purchases. After plunging to all-time lows two weeks ago, the MCOIN price has experienced a phenomenal surge during the past 48 hours. The digital asset continued to rise on Friday, rising 3.7% to trade at $0.408 on the daily chart. That indicates that from its historical lows, it has recovered by 36%.
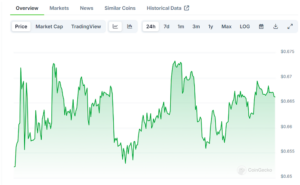
Though it gained 10 percent on Thursday alone, the market’s remarkable run over the past two days may indicate volatility that isn’t strong enough to support a long-term positive upturn. The daily chart displays a sharply negative trend, indicating a strong underlying pessimistic sentiment that may limit the price of MCOIN’s growth.
The M20 blockchain coin trades below its 20, 50, 100, and 200 Exponential Moving Averages (EMA) despite its recent increases. Thus, the majority of holders are probably in circumstances where they are losing money.
Thus, that might discourage a selloff in the short run. However, over the weekend, a recovery in the vicinity of the 20 or 50 EMA levels in the $0.417–$0.497 region would perhaps lead to some profit-taking, which might put pressure on the price.
Mcoin Price Indicators
The 2-hour chart’s MCOIN price momentum indicates that buyers are now in charge. To support this opinion, the price is far above the Volume Weighted Moving Average. The Money Flow Index (MFI) signal reading, however, suggests approaching the optimistic viewpoint with caution. Rather than a high positive money flow, the MFI is in the neutral-to-bearish zone with a reading of 50.
MCOIN Price Outlook Is Still Pessimistic
The price of MCoin tokens has created a “bear flag pattern,” a technical negative configuration. The 4-hour chart showed a bearish setup for the MCOIN USD pair.
On a price chart for cryptocurrencies, the bear flag pattern is seen when a short, abrupt countertrend movement—often called the flag—occurs after an earlier downward trend. Usually, the configuration indicates that the countertrend may be about to reverse.
During consolidation, volume levels in a bearish continuation scenario could drop or stabilize. FUD is frequently sparked by the market’s upward trend in reaction to the initial price decline during the consolidation phase of a bear flag setup.
Higher-than-average trading volumes are usually the outcome of the emotional reaction, as traders and investors reenter the market to either take advantage of or lessen the consequences of the price change.
The price objective of a bear flag pattern is determined by traders by deducting the length of the flagpole from the price level of the breakout. The price of MCOIN USD may therefore fall to $0.449, a 14% decrease from its present level.
Levels of Resistance and Support
If the price stays above the pivot point at the 0.395 level on the 30-minute chart above, the bulls will probably be in charge. They may then advance to 0.410 when they might run into the first obstacle. If they maintain control over that barrier, though, they might be able to break through and continue on to try the second resistance level at 0.424, thanks to the momentum that would follow.
But if the price drops below 0.395, the bears could seize the initiative. In that case, the initial support might be created around 0.385. Extended control, however, would allow the sellers to cross that threshold, disproving the upward story and perhaps challenging 0.370.
The MCoin Pirce Is Unable to Continue Uptrend
In the meanwhile, extended upper wick candles are seen on the daily timeframe chart, signifying bearish pressure on the coin. Due to the MCOIN INR pair’s worse performance than that of the MCOIN USD, MCOIN merchants in India faced significant difficulties.
The M20 team hasn’t done much to advertise the initiative. Despite having more than 16,000 followers, the MCOIN X social media team has only posted 355 posts since June 2023. Perhaps the group favors more natural kinds of promotion.
Centralization of governance as a result of the founding team’s heavy influence and the possibility of sell-offs from the 10% allotment to founders are potential warning flags.
Conclusion
In conclusion, Mcoin’s recent surge offers a glimmer of hope for traders, but the broader outlook remains cautious. Despite recovering from all-time lows, the bearish indicators and technical patterns suggest that the uptrend may be short-lived. The token’s inability to break key resistance levels, coupled with low promotional efforts and governance concerns, adds to the uncertainty. As Mcoin continues to trade below crucial moving averages, the risk of further declines remains, with potential sell-offs looming if the price fails to sustain its momentum. Traders should approach with caution, keeping a close eye on the key support and resistance levels in the coming days.